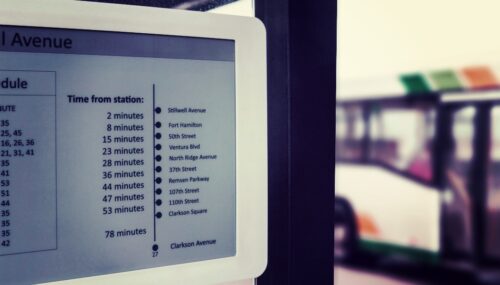
Take charge of your electronic paper signs
Visionect, 28 Nov 2014
Evolution is key: we have updated the Visionect server software and made the preview packages available for download. And here’s why you should be as excited as we are.
Our new server software can integrate with your signage application, CMS or even more complex backend systems.
Evolution is key: we have updated the Visionect Server and made the preview software packages available at docs.visionect.com to allow you to better take charge of your electronic paper signs. The software comes with a free license, and you can use it as a cloud based service or host it locally – it’s totally up to you.
The new software can integrate with your signage application, content management system (CMS) or even with more complex backend systems. It is designed to help you control the sea of electronic paper signs you plan to deploy, and it’s now made even better and more user friendly.
Simple management of electronic paper display units
Our revamped manager helps you track what’s currently displayed on screen and check up on sign health through a beautiful web based interface. It wasn’t complicated before, but there’s no reason why we shouldn’t make it even simpler and more user-friendly. In short, as easy as pie.
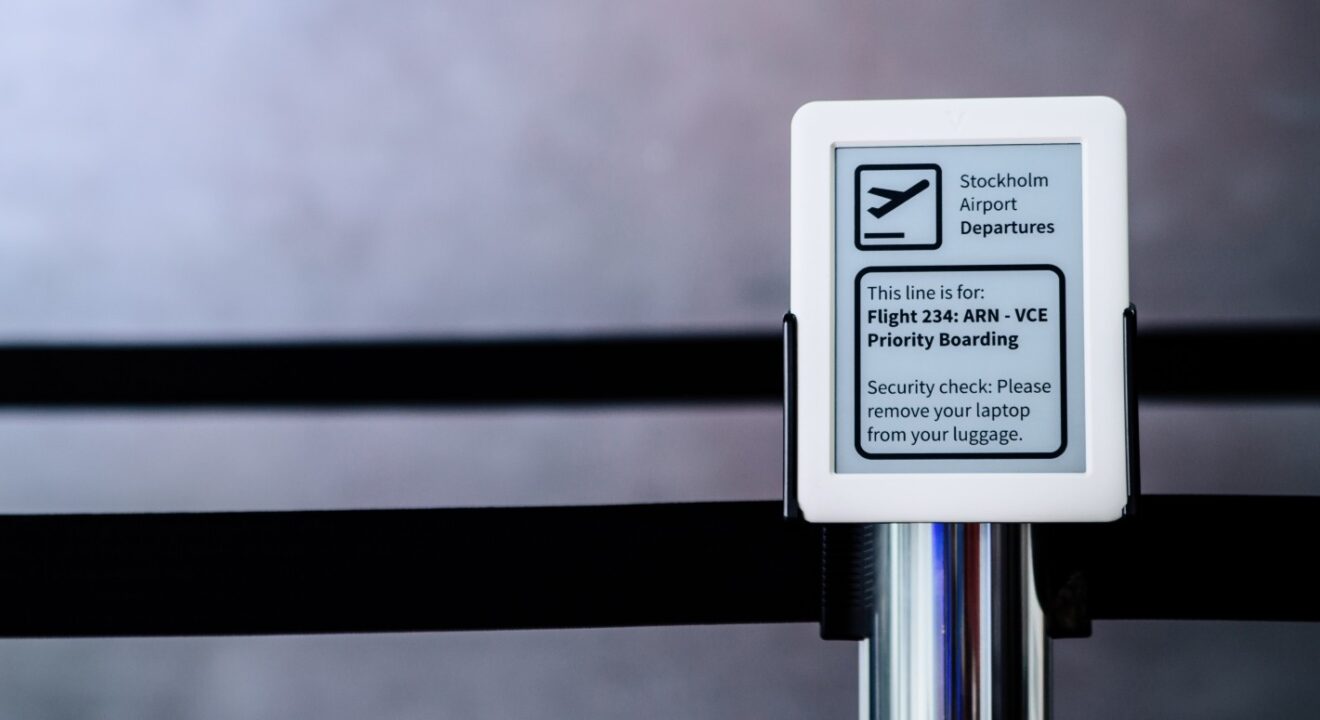
Change the content of what should be displayed on the screen in your own CMS and our server will make sure that all your alterations are streamed to the e-paper signs in no time, wherever they may be. In this way you can keep tabs on what is happening with your e-paper sign – no matter what the sign is for.
Be in charge of your devices, no muss no fuss
So what exactly is new? How is the revamped software made even more helpful? Let us count the ways.
OVERVIEW OF DEVICE STATUS, ALSO ON MOBILE
The server software now features a more user-friendly interface, making monitoring and managing your electronic paper displays even simpler, be it on your computer, tablet or a smartphone (for those of you always on the go).
Immediately upon logging in you can check the status of the e-paper solutions you have implemented: you can see the number of devices you have, and see which of them are online. Don’t forget to also check out the software version you are running and make sure that the servers are not overloaded with the thousands of devices you’ll be deploying in no time.
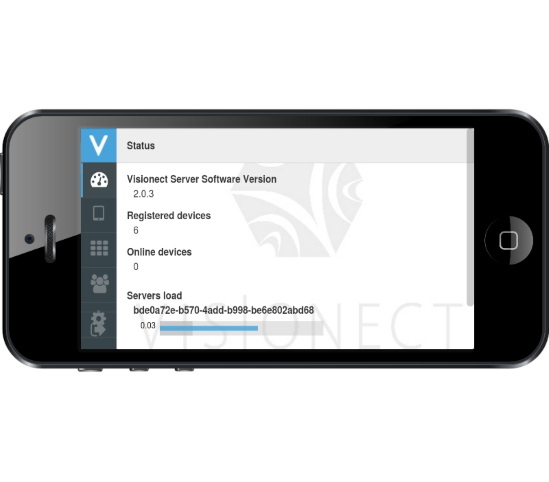
Monitoring and managing your electronic paper displays is simple and you can do it from your phone.
Digging deeper into the signs
Next, dig a bit deeper into what is happening with each of the electronic paper displays (EPDs).
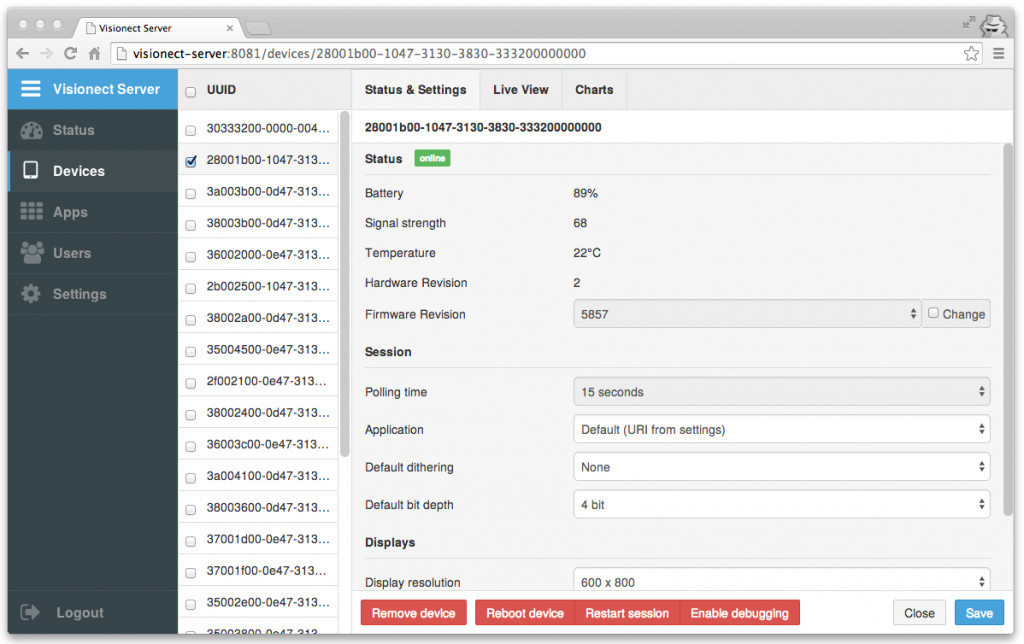
First up, a real-time recap of how your EPD signs are doing: are they online or not? How much battery do they have left? What is their signal strength? Firmware? Hardware revision?
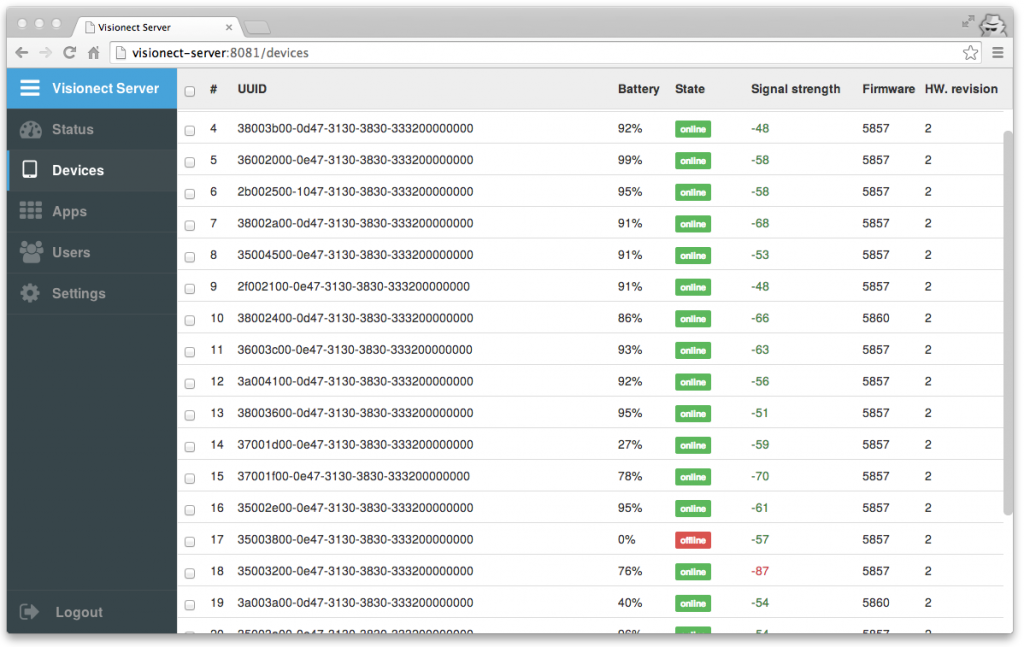
Make sure to charge the battery of the device that is offline and see what’s up with the poor signal strength of the device following it.
DISPLAY UNIT FINE TUNING
By selecting an individual device you can then oversee and change the details of how your digital sign is behaving in detail.
In addition to monitoring the battery and signal, as well as the inside temperature of the device, this menu provides details of the session your device is running, such as polling time, bit depth and the application that is being displayed. You can change all of these values at will, including the resolution of the electronic paper display, the number of screens it is showing, and their mode and rotation (do you want the content on your screen to be in landscape or portrait? Should it turn by 90°, 180° or 270° if tilted?).
Ah, decisions.
KEEPING TRACK OF USE, IN REAL TIME
But it gets even more fun.
The software also enables the monitoring of what is showing on your screens in real time. Do you have a parking sign set up somewhere and want to make sure it is still showing what it should? Or do you want to check what visitors are looking at on your interactive e-paper museum tablet? The Live View tab helps you do exactly that: see what your target audience is seeing in that very moment.
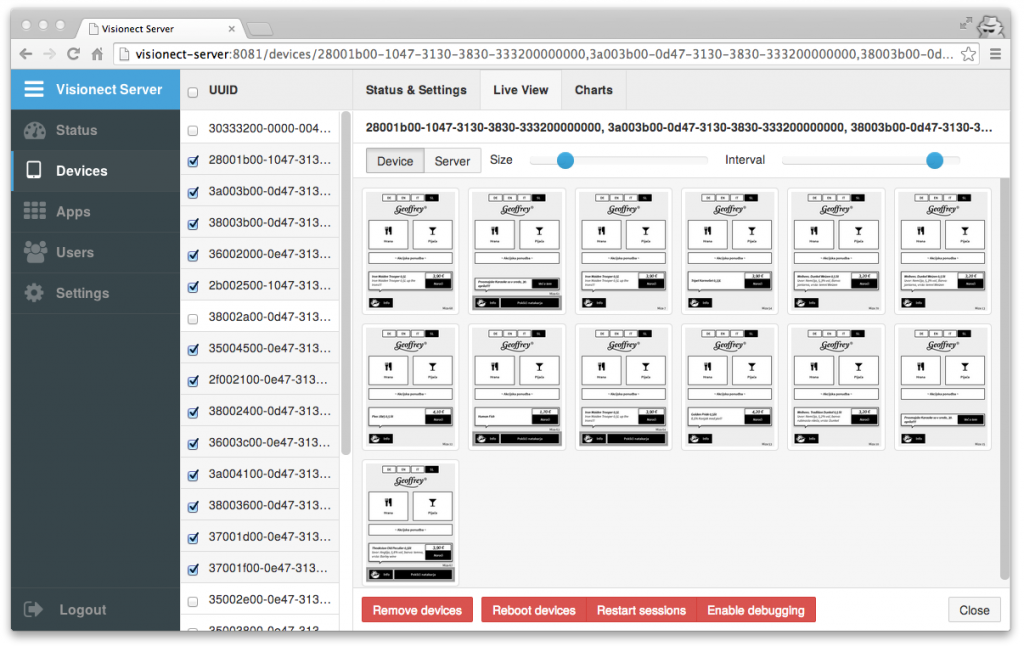
What a lovely view.
PERFORMANCE ANALYTICS IN CHARTS
If you’re a visual sort of person or at the very least interested in seeing how your electronic paper digital signs have been performing over time, then the Charts section of our software solution is just the thing for you.
Be it for one device only or for all devices you have registered, see device behaviour over time – everything from battery performance to signal strength and disconnects, for exactly the time span you have set. In this way you can analyze the performance of the e-paper displays over time to see if all is as it should be, and never be caught off guard again.
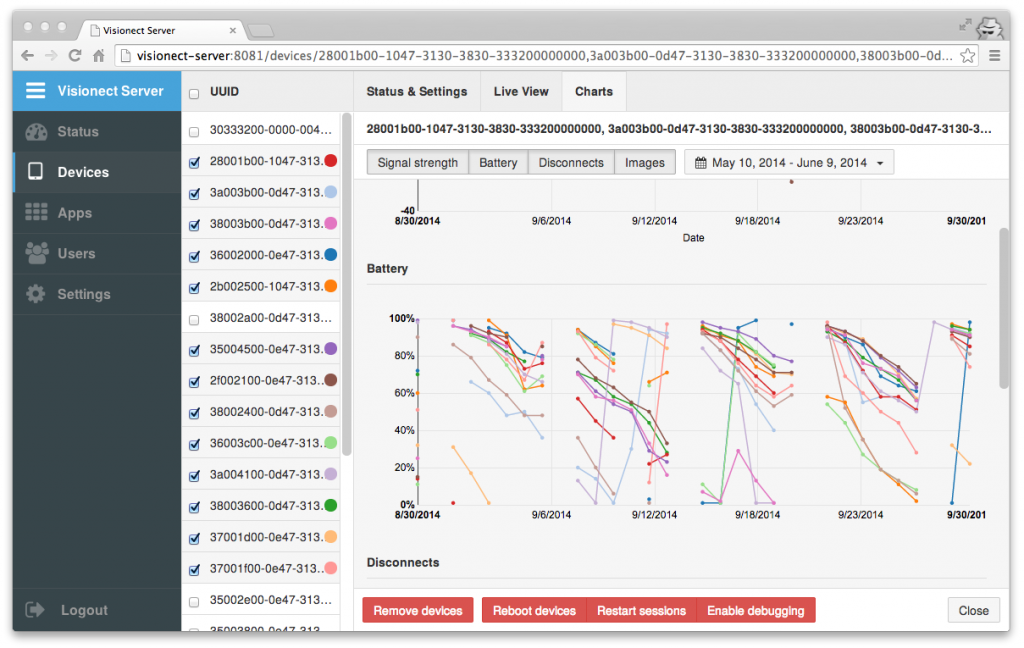
Performance analytics in action.
It’s Go time!
And to finish off, a gem that might interest you developers out there: our software is now written in the Go programming language. You know: less lines of code, more actual work being done, deadlines that are more timely. Not to mention in less need of debuggers. Or as Napsy, our platform developer put it: it’s more fun! And we like to think that reflects back on us also.
Tags